

News & Posts
Eye Tracking Metrics for Usability Testing in 2026

What if your user's long, lingering gaze isn't a sign of deep engagement, but a symptom of profound cognitive paralysis? In the high-stakes environment of human-machine interaction, misinterpreting a few milliseconds of visual attention can lead to UI decisions that inadvertently increase friction rather than resolve it. You've likely felt the frustration of manual gaze coding or struggled to explain to stakeholders why a specific scan path justifies a total redesign. It's a common challenge in behavioral research where the line between interest and confusion often blurs.
Eye Tracking Metrics for Usability Testing in 2026
This guide empowers you to master the essential eye tracking metrics for usability testing required to quantify user attention and diagnose hidden cognitive friction. We’ll move beyond simple heatmaps to establish a sophisticated hierarchy of metrics, from time-to-first-fixation to advanced pupillometry for measuring cognitive load. You’ll learn how to transform raw gaze data into high-impact usability improvements that resonate with both users and stakeholders. We’ll also explore how Prophea.X synchronises these visual signals with other biometric sensors to reveal the human story behind the screen. Let’s bridge the gap between biological physics and visionary design.
Key Takeaways
- Establish a quantitative bridge between visual behavior and cognitive intent by moving beyond the superficiality of traditional heatmaps.
- Analyze fixation duration and saccade frequency to accurately distinguish between deep user engagement and hidden processing difficulties.
- Quantify mental effort and fatigue using advanced pupillometry and blink rate metrics to understand the physiological cost of your interface.
- Diagnose specific UX friction points by mapping eye tracking metrics for usability testing to behavioral patterns like search errors and poor information scent.
- Accelerate your research timeline by leveraging Prophea.X to automate the extraction of complex gaze data into actionable UI/UX optimizations.
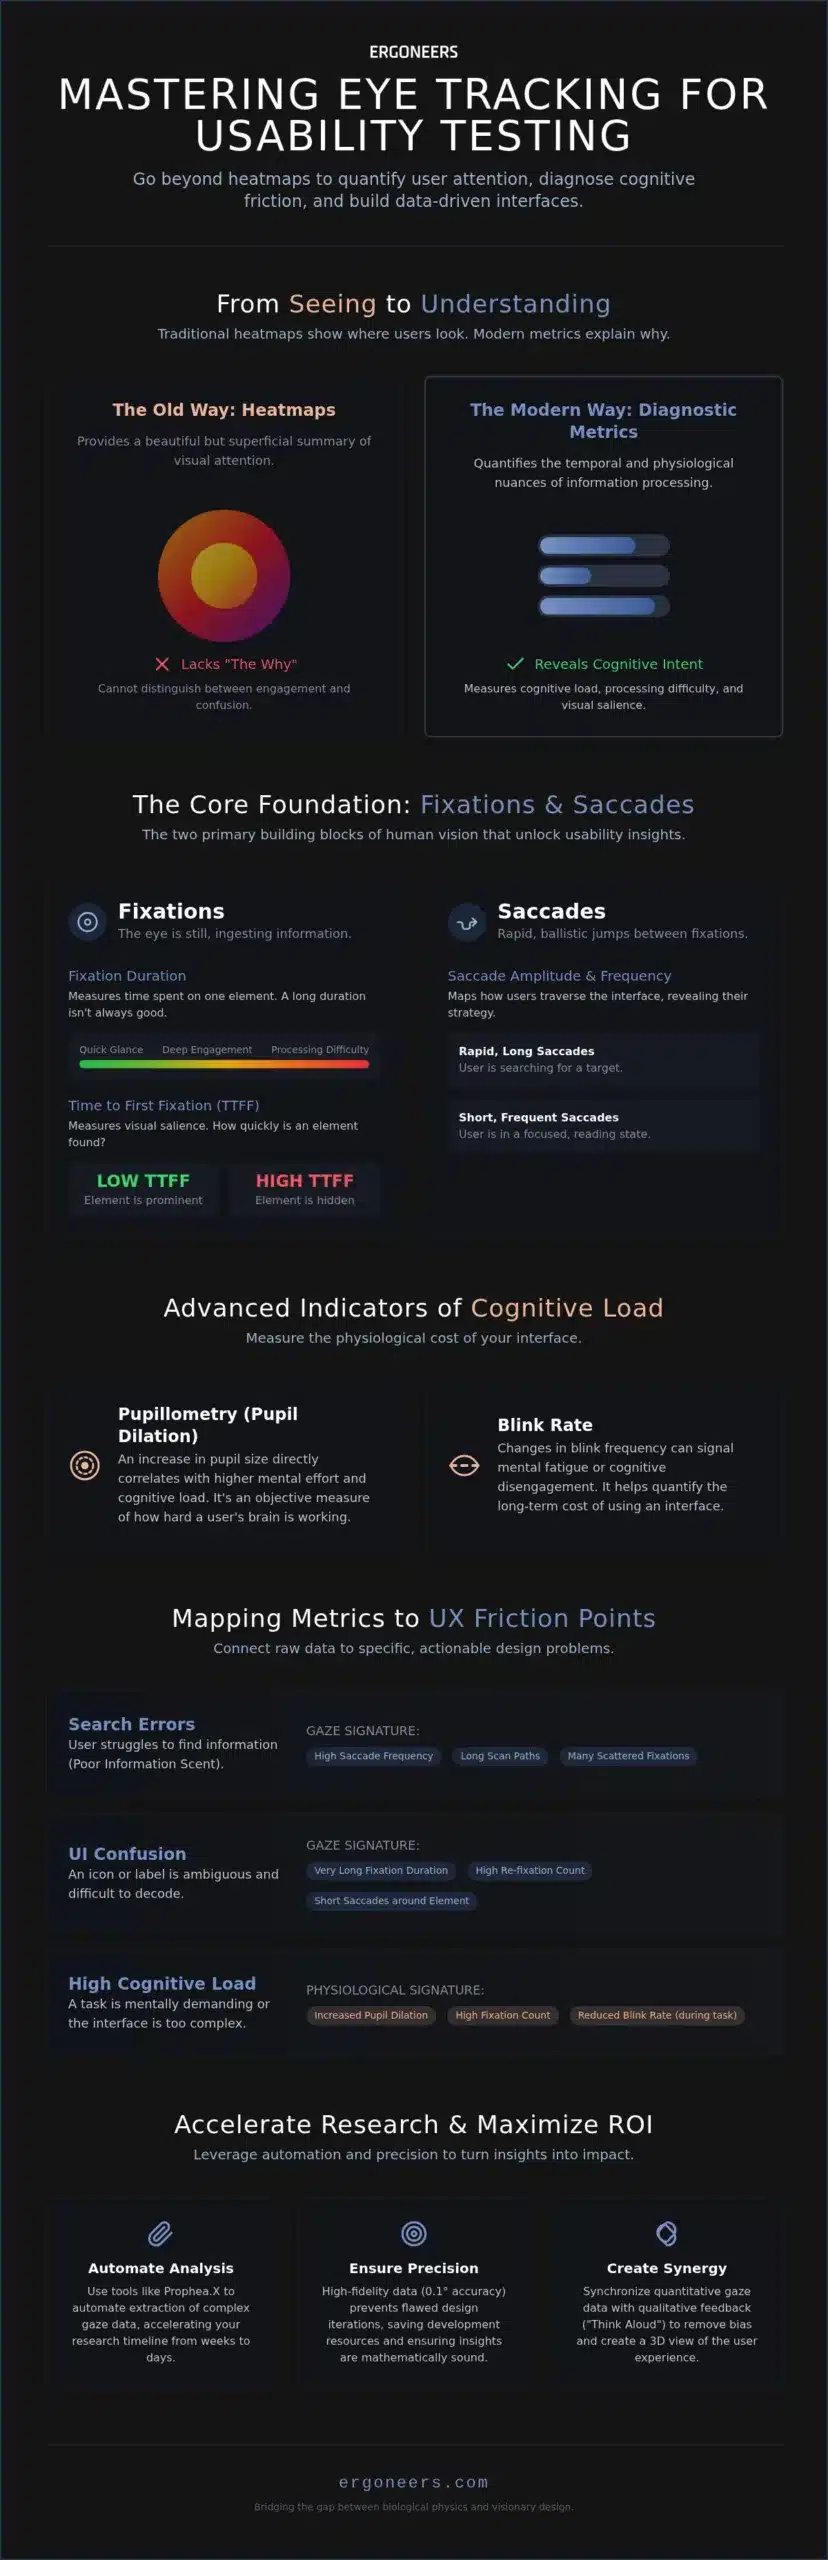
Table of Contents
- Beyond the Heatmap: Why Eye Tracking Metrics Define Modern Usability Testing
- The Core Foundation: Fixation and Saccade Metrics for Visual Attention
- Advanced Indicators: Cognitive Load, Pupillometry, and Multimodal Synchronization
- Synthesizing Data: Mapping Gaze Metrics to Specific UX Friction Points
- Propelling Research Forward: Automating Usability Analysis with Prophea.X
Beyond the Heatmap: Why Eye Tracking Metrics Define Modern Usability Testing
Heatmaps are beautiful, but they’re often just digital ink. In 2026, the industry has transcended simple visual summaries to embrace a more rigorous methodology. We define eye-tracking metrics for usability testing as the quantitative bridge between raw user behaviour and underlying cognitive intent. While a heatmap tells you where a user looked, it fails to explain the nature of that attention. Are they captivated or confused? Modern research demands a shift from mapping spatial location to analyzing the temporal and physiological nuances of how information is processed. This evolution represents the transition from merely seeing to truly understanding the human at the center of the technology.
Diagnostic metrics provide the “why” that descriptive visualizations lack. High-precision hardware like Dikablis Professional enables researchers to capture these nuances with clinical accuracy, ensuring that every data point contributes to a robust usability conclusion. By focusing on discrete data streams, we transform subjective observations into empirical evidence. This allows us to expand the boundaries of scientific knowledge within the behavioral lab. We no longer guess at user frustration; we measure it.
The ROI of Precision in Usability Metrics
Precision isn’t just a technical spec; it’s a financial safeguard. When testing intricate mobile interfaces or dense software dashboards, a 0.1-degree accuracy threshold becomes critical. Low-frequency trackers often introduce “false positives”, where gaze data appears to land on a button when the user was actually focused on the adjacent label. These inaccuracies lead to flawed design iterations that waste development resources and delay product launches. High-fidelity data ensures that your usability testing results are built on a foundation of truth. Reliable metrics allow teams to make bold UI changes with the quiet confidence that their insights are mathematically sound.
Qualitative vs. Quantitative: A Symbiotic Relationship
Metrics don’t replace the human element; they empower it. Traditional “Think Aloud” protocols and user interviews provide essential context, but they’re prone to participant bias and post-hoc rationalization. Quantitative gaze data acts as an objective validator, confirming whether a user’s verbal feedback aligns with their actual visual path. This synergy removes observer bias, allowing researchers to see past what users say to what they actually do. By synchronizing these streams, we create a three-dimensional view of the user experience. Diagnostic gaze analysis has officially become the gold standard for 2026 usability labs, providing the structural integrity required for next-generation HMI research.
The Core Foundation: Fixation and Saccade Metrics for Visual Attention
Mastering the fundamental eye tracking metrics for usability testing requires a shift from viewing gaze as a static point to viewing it as a dynamic, temporal sequence. At the heart of this analysis lie fixations and saccades, the two primary building blocks of human vision. Fixations occur when the eye remains relatively still, allowing the brain to ingest information. Saccades are the rapid, ballistic jumps between those points. By isolating these movements, you gain an empirical view of how a user’s attention is distributed across an interface, providing the data needed to move beyond subjective design critiques.
Analyse fixation duration with clinical precision. While some researchers mistakenly equate long pauses solely with deep engagement, in a usability context, they often signal processing difficulty or cognitive bottlenecks. If a user fixates on a simple icon for 500 milliseconds, they aren’t admiring the art; they’re struggling to decode its meaning. Conversely, Time to First Fixation (TTFF) measures the visual salience of your most critical elements. A low TTFF for a primary “Buy” button confirms your visual hierarchy is working. If it’s too high, your design is burying the lead.
Leverage Saccade Amplitude and Frequency to map how users traverse your digital landscape. Rapid, long saccades suggest a user is searching for a target, whereas shorter, more frequent saccades indicate a focused, reading state. High Fixation Count and Density in a specific region usually point to visual clutter. These “hotspots” of high density often distract users from their primary tasks, creating unnecessary noise in the human-machine interaction loop.
Optimizing Areas of Interest (AOI) for Usability
Defining dynamic AOIs is essential for complex studies involving moving UI elements or head-mounted displays. By calculating the ratio of fixations within versus outside target AOIs, you can mathematically prove whether a feature is capturing the intended focus. Prophea.X provides the computational agency to automate this AOI-based metric extraction, significantly reducing the time spent on manual data coding. This automation allows you to consult with our experts to refine your testing protocols for maximum ROI.
Scanpaths and Gaze Sequences
The logic of a user’s visual journey is best captured through scanpaths. These sequences reveal the mental model a user employs when navigating a workflow. Watch for “backtracking” saccades, where the eye repeatedly returns to a previous element. This behavior is a clear sign of navigation friction or lack of “information scent.” Visualizing these sequences empowers you to present findings to non-technical stakeholders with a clarity that raw numbers cannot provide. It transforms abstract data into a visible, human story of struggle or success.
Advanced Indicators: Cognitive Load, Pupillometry, and Multimodal Synchronization
Elevate your research by moving beyond spatial gaze points into the physiological reality of the user experience. While fixations show us the target of attention, they rarely reveal the internal cost of that focus. Advanced eye tracking metrics for usability testing now incorporate pupillometry and blink dynamics to measure cognitive load with clinical precision. These metrics allow you to detect when a user is approaching a state of mental saturation before they even commit an error. By monitoring the autonomic nervous system’s response, you gain the agency to redesign interfaces that respect the biological limits of the human mind. You’re no longer just tracking eyes; you’re quantifying the human experience.
Pupillometry serves as a high-fidelity proxy for task difficulty and mental effort. In high-stress environments like surgical suites or flight cockpits, pupil dilation correlates directly with increased error rates and decision-making delays. However, raw pupil data is notoriously susceptible to environmental light changes. Using D-Lab software, researchers can filter this “noise” from the true “signal” of cognitive demand, ensuring that your findings reflect mental processing rather than ambient lighting. This level of data integrity distinguishes a visionary lab from a standard usability clinic. It ensures your conclusions are rooted in biological fact rather than environmental coincidence.
Measuring Mental Effort through Gaze
Adopt the Index of Cognitive Activity (ICA) to provide a nuanced view of cognitive state mapping in 2026. This metric captures the rapid, involuntary dilations of the pupil that occur during complex problem-solving. Unlike general pupil size, the ICA remains robust against slow-moving light variations, making it an essential tool for naturalistic usability testing. When you quantify these physiological spikes, you can pinpoint the exact millisecond a user experiences a cognitive bottleneck. This empowers you to iterate on UI elements that are mathematically proven to reduce mental strain. It’s about creating a seamless flow between the user’s intent and the machine’s response.
Multimodal Synchronization: The Visionary Edge
True behavioral insight exists at the intersection of multiple data streams. By synchronizing gaze with EEG, researchers can map specific cognitive states to visual targets, creating a holistic view of the user’s mental landscape. You might combine eye tracking with EMG to study physical strain during tool usage or integrate heart rate variability (HRV) to assess frustration levels in real-time. This level of custom eye tracking integration is the key to unlocking the next phase of human factors research. We define multimodal behavioral coding as the seamless synchronization of physiological and gaze signals to create a unified data narrative. This approach ensures that every usability conclusion is backed by a multi-dimensional proof point, leaving no room for observer bias.
Synthesizing Data: Mapping Gaze Metrics to Specific UX Friction Points
Synthesize raw data into diagnostic power by transforming abstract numbers into a blueprint for design intervention. In the sophisticated landscape of 2026, simply collecting eye tracking metrics for usability testing is insufficient; you must map these signals to the specific cognitive hurdles your users face. This process moves beyond observation toward a predictive understanding of human-machine friction. By triangulating different gaze behaviors, you can isolate exactly where an interface fails to meet human needs.
Map your visual landscape with clinical precision to uncover hidden usability flaws. If a participant exhibits a high Fixation Count alongside a delayed Time to First Fixation (TTFF), they are likely experiencing a search error where the target element lacks sufficient visual salience. Conversely, high fixation duration on an identified icon suggests a recognition error; the user has found the element but cannot decode its functional intent. You can further identify “Information Scent” issues by analyzing scanpath efficiency. A fragmented, non-linear sequence indicates that the user is hunting for cues that aren’t there. Measure discoverability by monitoring Area of Interest (AOI) revisit rates. If users repeatedly return to a static element, your design is promising a utility it doesn’t deliver, creating a cycle of frustration that erodes trust.
The ‘Confusion Index’ Framework
Quantify cognitive friction using a rigorous three-step process that identifies when a user is overwhelmed. First, monitor for elevated fixation durations that exceed your established baseline. Second, track for a spike in blink rates, which serves as a biological proxy for rising stress levels. Finally, correlate these physiological signals with low task completion rates. Prophea.X possesses the computational agency to flag these specific patterns automatically during live sessions, allowing you to witness the exact moment of cognitive collapse. This automated oversight is essential for Optimising Human Machine Interaction Studies and ensures that no subtle signal of user distress goes unnoticed in the lab.
Validation and Iteration
Leverage empirical data to justify every design iteration to your stakeholders. By comparing eye tracking metrics for usability testing across A/B variants, you can mathematically prove which layout reduces cognitive load. Use “Gaze-on-Target” percentages to provide an objective rationale for moving a call-to-action button or simplifying a navigation menu. This approach shifts the conversation from subjective “I think” statements to definitive “the data shows” conclusions. It empowers you to defend visionary design choices with the quiet confidence of scientific proof, ensuring that the human element remains the priority in every development cycle.
Ready to transform your behavioral research with automated metric extraction? Schedule a consultation with our research team to see how Prophea.X can accelerate your path to usability excellence.
Propelling Research Forward: Automating Usability Analysis with Prophea.X
Transform raw visual signals into strategic insights with the sophisticated agency of Prophea.X. As the next-generation ecosystem for behavioral analysis, this platform bridges the gap between high-precision data collection and actionable design intelligence. By merging the physical world captured by Dikablis Professional with the computational power of AI-driven ‘Auto-Gaze’ mapping, we eliminate the manual bottlenecks that once paralyzed research timelines. This automation ensures that your eye tracking metrics for usability testing are calculated with error-free precision, allowing your team to focus on synthesis rather than data entry. You’re no longer just running tests; you’re leading a technological revolution in human-centered design.
Prophea.X operates as a vital partner in the evolution of your research lab. It provides the intellectual framework necessary to handle the massive data volumes generated by modern HMI studies. The software’s ability to personify complex data streams into clear, rhythmic visualizations empowers you to present your findings with quiet confidence. This is the industrial-grade implementation that distinguishes visionary experts from those still struggling with fragmented tools. Empower your research team with the same capabilities used by the world’s leading automotive and aerospace innovators.
Seamless Multimodal Integration
Unify your data narrative by handling eye tracking, biosensors, and video feeds within a single, coherent timeline. Prophea.X achieves this through zero-latency synchronization, a critical requirement for high-precision human factors studies where milliseconds define the difference between success and failure. This holistic approach allows you to see how a spike in heart rate aligns perfectly with a specific gaze fixation on a cluttered UI element. To understand how these streams converge in complex environments, explore our Behavioral Research Software Guide. This unified framework ensures that your conclusions are rooted in the full spectrum of human behavior.
Future-Proofing Your Behavioral Lab
Scale your operations from single-user UX evaluations to complex multi-person interaction studies without losing scientific rigor. Our modular architecture allows your lab to grow alongside your research ambitions, moving seamlessly from traditional screen-based tests to naturalistic, real-world environments. The Ergoneers promise is one of reliable integration and error-free precision, ensuring your legacy of excellence remains intact as technology advances. If you’re designing a new facility or upgrading an existing one, consider our Behavioral Research Lab Consulting for a custom setup tailored to your specific industrial or academic goals. The future of human-technology interaction is being written now; ensure your lab has the tools to lead the way.
Mastering the Human-Technology Interface
The journey toward usability excellence requires a departure from superficial visualizations in favor of deep, diagnostic precision. By mastering eye tracking metrics for usability testing, you transform raw gaze data into a powerful narrative of cognitive intent and human effort. We’ve explored how the core foundation of fixations and saccades, when paired with advanced indicators like pupillometry, reveals the true biological cost of an interface. This level of insight is no longer a luxury for elite research; it’s the new standard for any lab aiming to lead the future of human-machine interaction.
Our precision engineered Dikablis hardware and Prophea.X software ecosystem are already empowering the world’s leading automotive and aerospace human factors labs to push the boundaries of behavioral research. Whether you’re optimizing a complex cockpit or a mobile interface, our expert-led behavioral research consulting ensures your lab is built for scientific rigor and industrial-grade implementation. Experience the Future of Behavioral Analysis with Prophea.X and take your place at the forefront of the industry. The next phase of human-centered innovation begins with the data you capture today.
Frequently Asked Questions
What are the most important eye tracking metrics for usability testing?
Fixations, saccades, and Time to First Fixation (TTFF) are the foundational pillars. Fixation duration reveals processing time, while saccade amplitude indicates search behavior. In 2026, researchers also prioritize pupillometry to quantify cognitive load. These metrics allow you to move beyond descriptive heatmaps toward a diagnostic understanding of user friction. By isolating these data points, you can mathematically prove where an interface succeeds or fails in capturing intended focus.
How do you distinguish between user interest and confusion in gaze data?
Distinguish these states by triangulating fixation duration with scanpath efficiency. Interest typically manifests as long fixations on high-value content with a logical, linear scanpath. Confusion often presents as long fixations on simple elements combined with “backtracking” saccades or fragmented gaze sequences. When you observe high fixation density in non-functional areas, it’s a clear signal of cognitive paralysis. Using Prophea.X helps automate this distinction by flagging atypical gaze patterns during live sessions.
Can eye tracking measure cognitive load and mental effort?
Yes, eye tracking measures cognitive load primarily through pupillometry and blink dynamics. Pupil dilation serves as a high-fidelity proxy for the autonomic nervous system’s response to task difficulty. Researchers use the Index of Cognitive Activity (ICA) to filter out ambient light noise and isolate true mental effort. High-precision hardware like Dikablis Professional ensures these subtle physiological shifts are captured with the clinical accuracy required for high-stakes human-machine interaction studies.
What is the difference between a fixation and a gaze point in UX research?
A gaze point is a single raw data sample representing where the eye is looking at a millisecond. A fixation is a cluster of gaze points that remain within a spatial area for a minimum duration; typically 100 to 300 milliseconds. While gaze points show raw movement, fixations indicate where the brain is processing information. Understanding this hierarchy is essential when analyzing eye tracking metrics for usability testing to ensure your conclusions are based on meaningful attention.
How many participants do I need for a quantitative eye tracking study?
Quantitative studies generally require 30 to 50 participants to achieve statistical significance and stable heatmaps. While qualitative “think aloud” tests might only need 5 to 8 users to identify major usability flaws, the mathematical rigor of metric-based analysis demands a larger sample size. This volume allows you to account for individual biological variations and ensures your gaze data represents a reliable cross-section of your target audience’s visual behavior.
Is eye tracking data reliable for mobile app usability testing?
Eye tracking is exceptionally reliable for mobile testing when using high-frequency wearable trackers like Dikablis Professional. These devices maintain 0.1-degree accuracy even as the user moves their head or shifts the device. Precision is critical because mobile UI elements are significantly smaller than desktop components. High-fidelity data prevents “false positives” where gaze appears to land on a button when the user was actually focused on the status bar or adjacent navigation.
How does multimodal data synchronization improve usability insights?
Multimodal synchronization provides a three-dimensional view of the user experience by linking eye tracking metrics for usability testing with EEG, EMG, or heart rate variability. This approach allows you to see the physiological “why” behind visual behavior. For example, you might correlate a long fixation on a specific menu with a spike in heart rate; confirming that the visual pause was caused by frustration rather than genuine interest. This unified data narrative removes observer bias.
What is the role of AI in analyzing eye tracking metrics in 2026?
AI plays a transformative role by automating the most time-consuming aspects of behavioral research; such as ‘Auto-Gaze’ mapping and object recognition. In 2026, platforms like Prophea.X use machine learning to automatically extract metrics from complex, dynamic Areas of Interest (AOIs). This reduces manual post-processing time by up to 80%, allowing researchers to move from raw data to actionable insights almost instantly. AI ensures that high-precision analysis remains scalable across large, multimodal studies.